Simulation Project
For my midterm project in The Nature of Code I set out to create an interface to display data representing my electricity use at home. I have been thinking about how my actions, like driving a car or leaving on a home appliance, have consequences in the environment through carbon emissions, however the connection often feels so abstract to be almost impossible to sense. How big is the impact of leaving on a light? Or running the air conditioning?
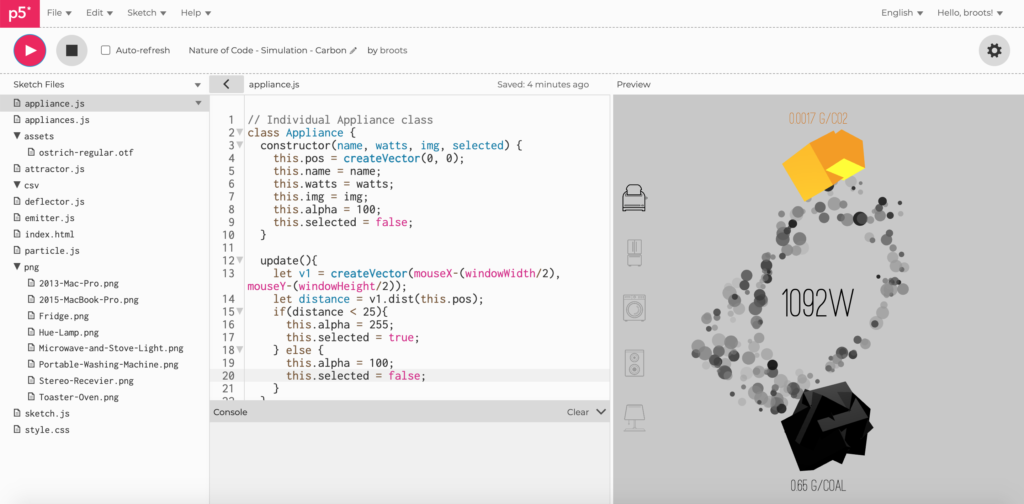
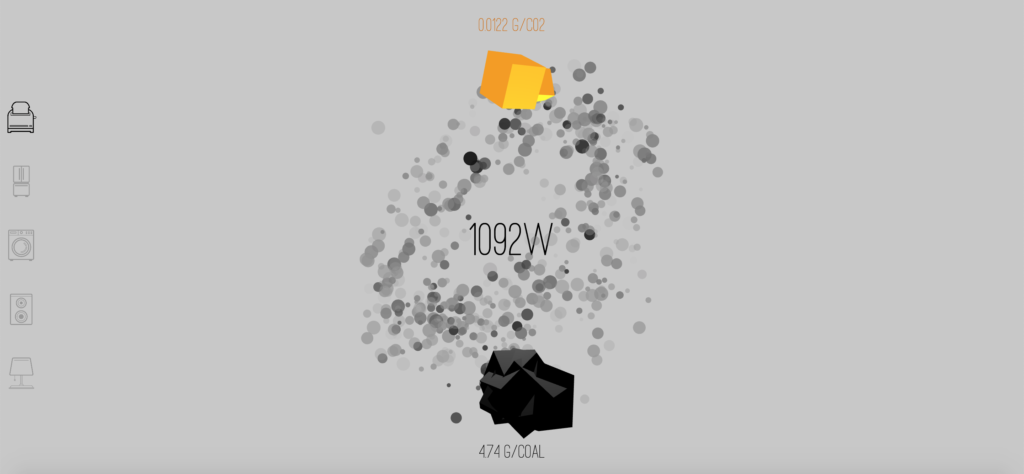
As part of a parallel project in the course Energy I reprogrammed a number of IoT Smart Plugs that are capable of measuring and reporting power draw for connected devices and with the modification are able to report wattage minute by minute. My idea for this simulation project was to create an interface and visual representation for that data and decode the numbers into tangible terms for the resources consumed and waste produced.
In terms of the design of the interface I wanted to make something that visually connects my power use to the impact on the environment. While the sketch runs it calculates the amount of coal that would be used to supply the current consumed and C02 generated by the process.
While I had hoped to utilize realtime data from my smart plugs I ran into an issue with the Blynk.io API I was using as a backend which is currently only functioning over HTTP and not HTTPS. Calling Fetch() in Chrome and Safari both returned errors I believe due to CORS involving a non secure URL.
In further iterations I would like to add options for other sources of energy, such as natural gas, nuclear, oil, wind, solar, and biomass. With more time I would also develop my own backend, moving away from Blynk.io, to make the visualizations represent realtime data. Link to the P5 sketch here.


